Instrumenting a running RT system for live visualisation is tricky: you want to observe signals without disturbing timing. Sockets, memory allocation, and formatting code have no business on an RT thread.
netsink
solves this by running as a separate, self-triggered luablock that
drains buffered connections and streams the samples over the network —
one message per sample, ready for PlotJuggler's
UDP server input. The RT chain never touches a socket.
Note:
netsinkwas previously calledudpsink. It does everythingudpsinkdid (JSON over UDP) and adds a ZeroMQ transport and a MessagePack encoding. Migration is a one-word change: swapluablock:udpsinkforluablock:netsink— thelua_strconfig is identical and still defaults to UDP + JSON.
Setup
Instantiate it as luablock:netsink and declare ports and destination
via lua_str:
blocks = {
    { name="sink", type="luablock:netsink" },
},
configurations = {
    { name="sink", config = {
        thread = 1,
        period = 100,  -- self-trigger at 10 Hz, independent of the RT ptrig
        lua_str = [[
            ports = { ts="double", sin="double", cos="double" }
            host  = "127.0.0.1"
            port  = 9870
        ]],
    } },
},
Each ports entry becomes an input port — key is the port name and
message field name, value is any registered ubx_type. Structs and
arrays are serialised too, not just scalars.
Transports and formats
Two more lua_str globals pick how the samples leave the node:
| global | values | default |
|---|---|---|
transport | "udp" or "zmq" | "udp" |
format | "json" or "msgpack" | "json" |
- UDP sends one datagram per sample to
host:port— connectionless, best-effort, exactly what PlotJuggler's UDP JSON input expects. - ZeroMQ publishes on a
PUBsocket bound touri(defaulttcp://*:9870); subscribers connect andSUBSCRIBE "". Sends are non-blocking, so a slow or absent subscriber never stalls the sink. - JSON is newline-delimited and human-readable; MessagePack (via
lua-MessagePack) is a compact binary encoding of the same flat map.
Both UDP and ZeroMQ are driven straight through the LuaJIT FFI, so there
is no luasocket or lzmq dependency — only the transport/encoder you
actually select needs to be present.
To stream MessagePack over ZeroMQ instead of the default:
lua_str = [[
    ports     = { ts="double", sin="double", cos="double" }
    transport = "zmq"
    format    = "msgpack"
    uri       = "tcp://*:9870"
]],
Connections
Wire your signals to the sink ports as usual, with deep buffers to absorb the rate gap between the fast RT producer and the slow NRT sink:
connections = {
    { src="ramp.out", tgt="sink.ts",  config = { buffer_len = 16 } },
    { src="sin.y",    tgt="sink.sin", config = { buffer_len = 16 } },
    { src="cos.y",    tgt="sink.cos", config = { buffer_len = 16 } },
},
Each sink step drains the full buffer and sends one message per sample, so no data is lost and the RT chain never blocks.
The ts port
When the sink runs at a lower rate than the producer, wall-clock
timestamps collapse the time axis — ten samples produced at 100 Hz all
appear stamped at the same 10 Hz read instant. To fix this, name one
port ts and netsink uses it as the timestamp instead:
{ src="ramp.out", tgt="sink.ts", config = { buffer_len = 16 } },
Any monotonically increasing signal works: a ramp, a step counter, a
cycle index. In PlotJuggler, select ts as the timestamp field and the
time axis unfolds correctly.
Running
The example USC picks transport and format from the environment, so you can switch without editing the file:
# UDP + JSON (default) — for PlotJuggler
$ ubx-launch -t 10 -c netsink.usc

# MessagePack over ZeroMQ
$ NETSINK_TRANSPORT=zmq NETSINK_FORMAT=msgpack ubx-launch -t 10 -c netsink.usc
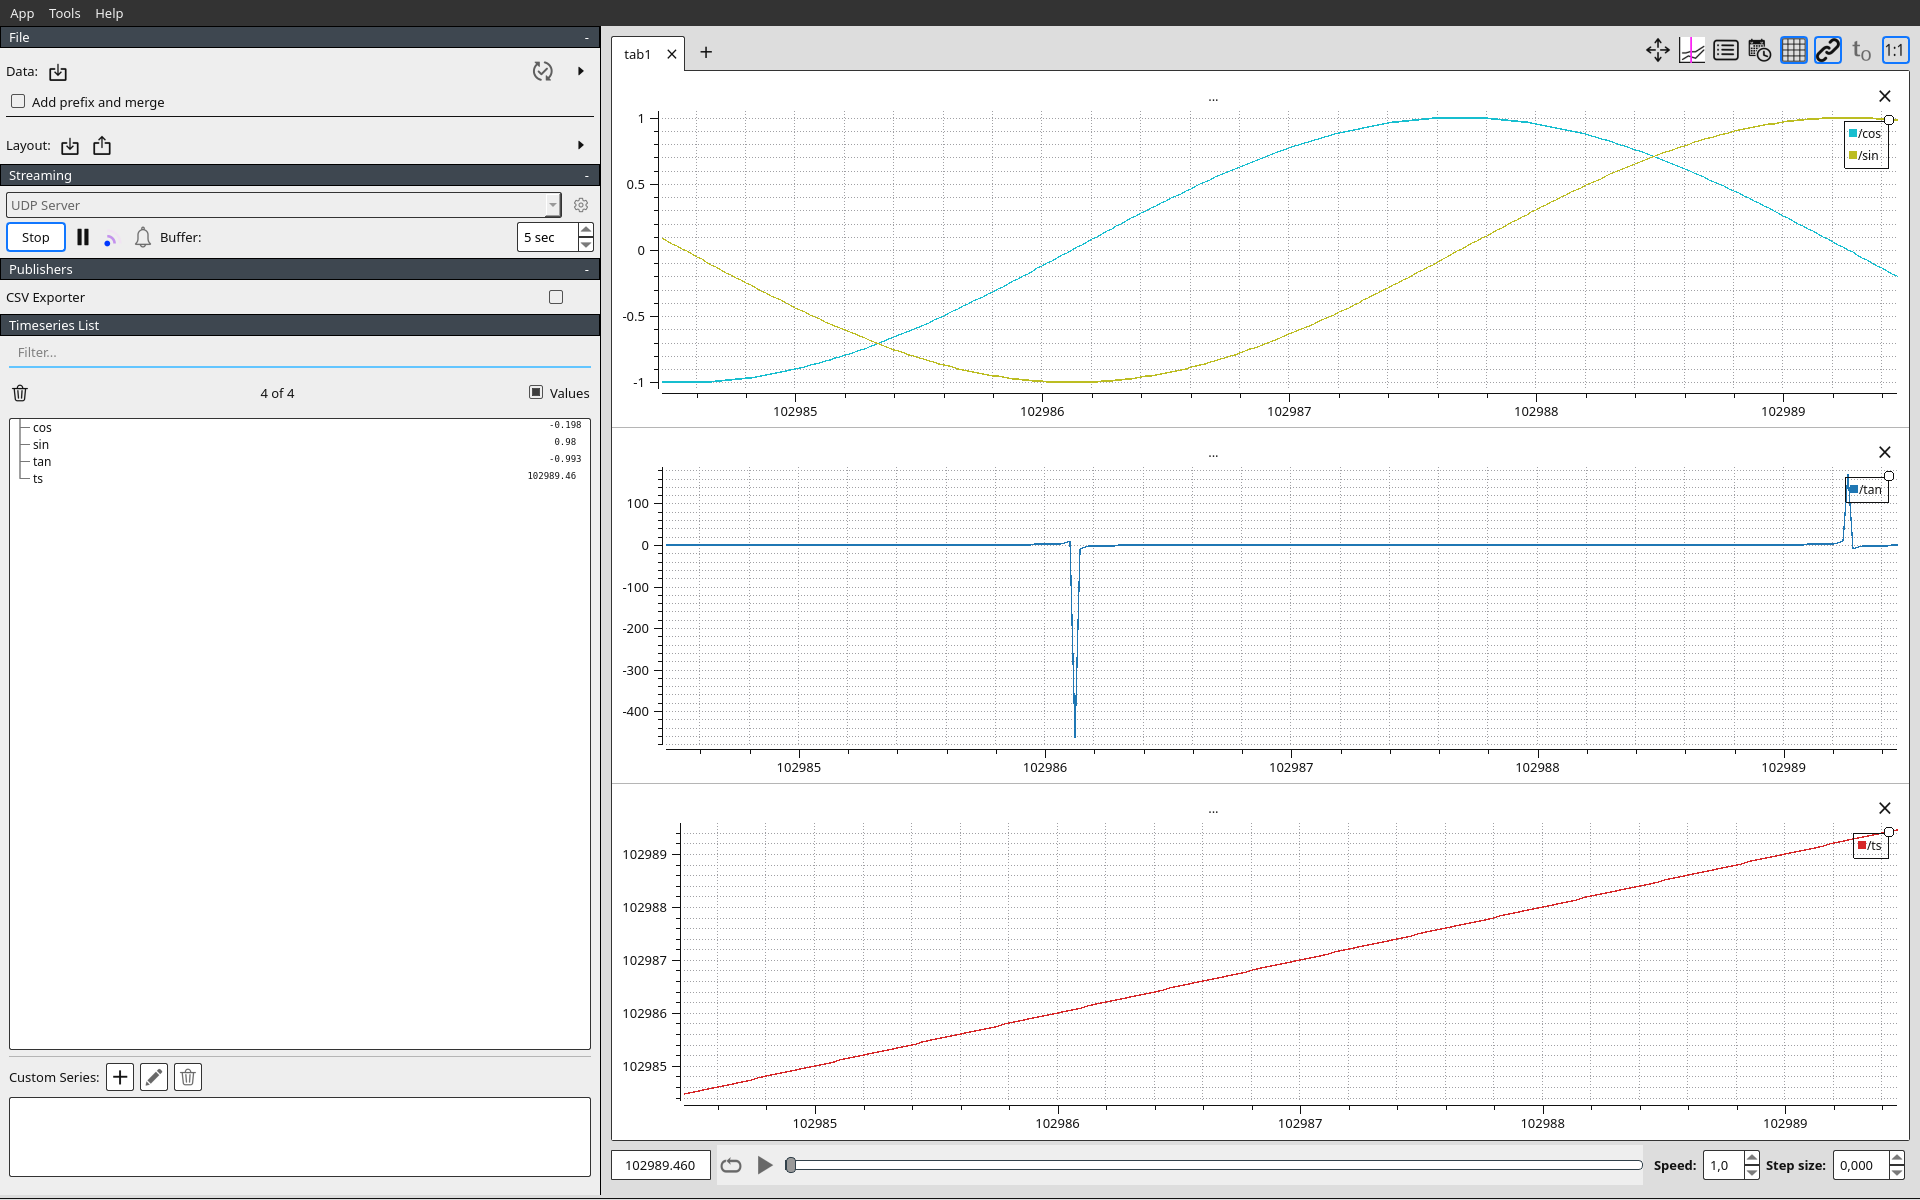
In PlotJuggler: Streaming → UDP Server → port 9870, select ts as
the timestamp.